
Musical Instruments & Amplification
BassLab Instruments
Distributed in North America by GH Services
These tests compared two instruments, one made of the BassLab Tunable Mixed Composite (here designated as "C"), and one made of wood (called "W"). Both were identical neck beam test beds with matching dimensions, electronics, and hardware, except for the different body materials (and, of course, construction methods). Both instruments were run directly into the soundcard of a PowerMac G4.
I recorded single notes on both of them. Each measurement lasted about 45 seconds. I only analysed lower notes, since they would more clearly show differences. I played the first fret on the lowest string (low C). Afterwards I attempted to normalise the output levels as well as possible. "As well as possible" means that, when using the computer, it is not always clear how and which algorithm the software author used to equilibrate the levels. I also needed several attempts until I could play with nearly the same force.
The analysis included:
All plots have the time on the X-axis. On the left is always the composite instrument (C), while the wooden one (W) is on the right. All analysis was done for the first 20 seconds of sound. The software didn't allow me to put the time values directly into the graphs. There might be differences in overall charts lengths in the range of about 0.5 sec.
Figure 1: Band power history at 31Hz, measured over the 12th of an octave
The first thing to notice in Figure 1 is the initial attack, where both start at nearly the same loudness. Immediately afterwards, the "volume" of the tone of W is lowered by approximately 8%, while C just has a short moment of "thinking" (hard to see on this image resolution), before the string produces the tone at an even higher volume than W. After 20 seconds, the output volume is still approximately 15% higher in C.
See also Figures 2 and 3, where this is more significant in different frequency bands. Figure 2 is a broad sampling (4 octaves), showing an overall envelope, while Figure 3 isolates a narrower frequency range (1/6th of an octave).
Figure 2: Band power history at 100Hz, measured over 4 octaves
Figure 3: Band power history at 168Hz, measured over the 6th of an octave
Figure 3 is particularly revealing. Compared to the smooth decline on the C chart, the W chart shows deep "dips" illustrating uneven (and excessive) absorption of sound energy. Other frequencies in this range give comparable results. A weaker set of overtones on W (where the initial overtone volumes are much lower) results in a big difference after 20 seconds.
Doing the same measurement around 500Hz (Figure 4, here over an octave) gives a much bigger difference in the initial volume, although the band power after 20 seconds is comparable. This is likely due to the reduced absortion of wood in this frequency range.
Figure 4: Band power history at 500Hz, measured over 1 octave
The spectrograms show again the time on the X-axis, while the frequency is on the y-axis. A black color represents zero output, while the others go from red (high output) to blue (low output). There is lot to analyse in the plots, but the most important thing in association with colors is first impression.
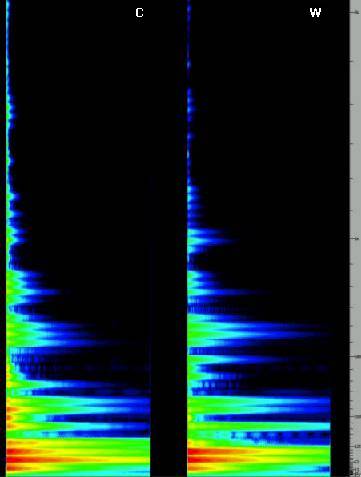
Figure 5: Spectrogram up to 2kHz
The C (left) side of Figure 5 shows an overall smoother chart, with more amplitude in the higher bands and more red/yellow in the lows, which can stand for a "richer" sound regarding the number of produced frequencies, and enhanced sustain. The differences aren't so significant for frequencies around 400Hz to 500Hz (the region where wood produces the familiar warmth in the tone), but C still produces more initial output at those frequencies.
C also shows a more balanced progression of responses through all frequencies, whereas W shows a number of oddly emphasized regions (e.g. resonant peaks below 250Hz, 500Hz, and 1000Hz), as well as the general reduction in output at higher and low frequencies.
Figure 6 shows the same measurement in a higher resolution for frequencies up to 1kHz.
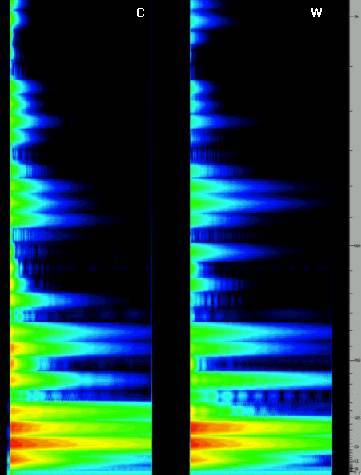
Figure 6: Spectrogram up to 1kHz
BassLab's Tunable Mixed Composite material shows "audiophile" qualities: smooth and transparent response at all frequencies, and few (if any) frequency- or time-related artifacts. The BassLab material allows other sonic factors (like body shape and string composition) to come through without coloration.
It can also be seen that the Tunable Mixed Composite has some measurable qualities like enhanced sustain and shortened reaction time (which stands for sensitivity and attack) as compared to wood. Of course, different woods absorb frequencies differently, but the BassLab Composite material can be formulated for any desired response, which is why it is called Tunable.
A clear difference from most other synthetic materials is that BassLab's Tunable Mixed Composite doesn't produce significantly (or even anything) less in any area, which is a problem with most other materials, like normal carbon fibre where a warm tone is often missing.
| Get Yours! |
| Use our easy Price Request Form to get a quote on your own BassLab! |
Reviews:
Tests:
Seminars and Shows: